Kate Margallo
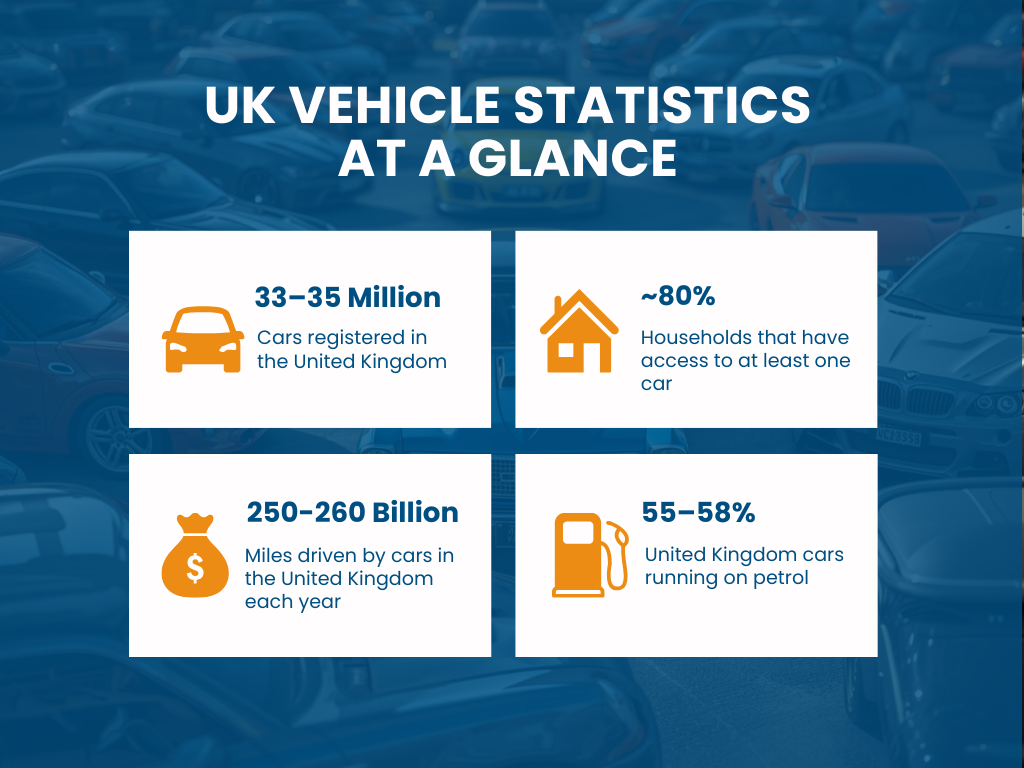
Around 33–35 million cars are registered on United Kingdom roads, and drivers rack up roughly 250 billion miles each year. From everyday commuting and weekend trips to cross-country moves and online car purchases, private cars drive transport demand, emissions, and pressure on national infrastructure. Even as electric vehicles grow fast, petrol and diesel still dominate the fleet, and total car mileage is still hovering near record highs.
Meanwhile, the car market is changing how vehicles move. Digital marketplaces, remote buying, and shared transport models are pushing more cars into long-distance transport and reshaping UK car logistics. In this article, we pull together the key UK car statistics for 2026, combining official national data with aggregated transport marketplace insights to show how cars are owned, used, and moved across the country.
How Many Cars Are There in the United Kingdom?
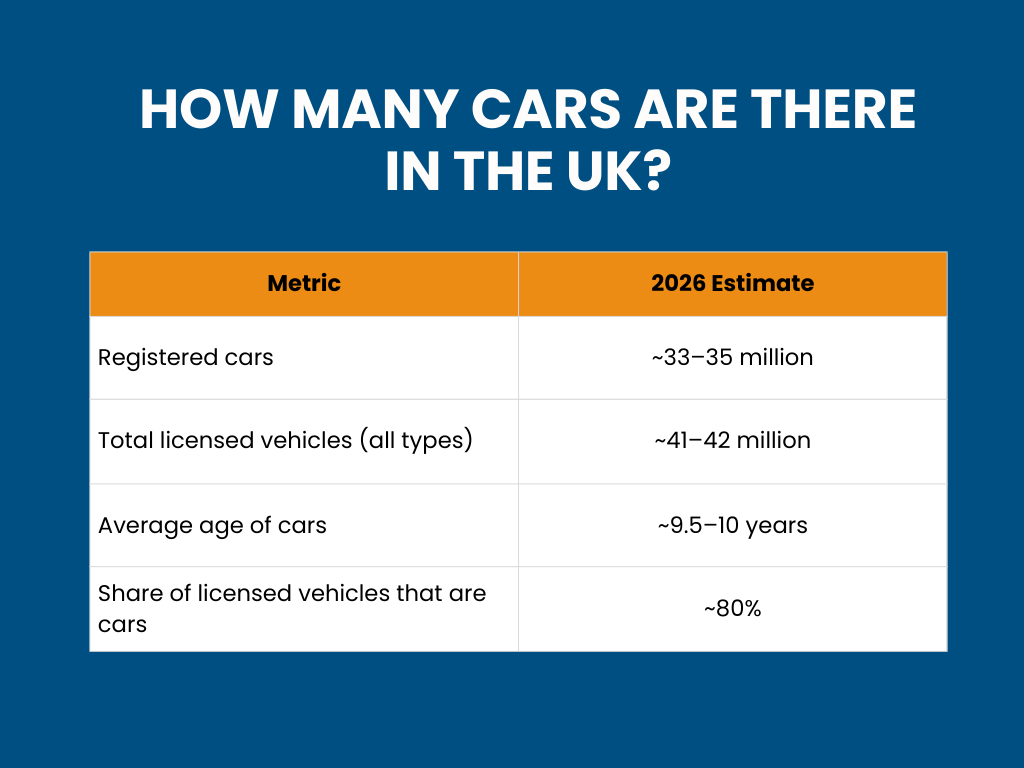
There are around 33–35 million registered cars in the UK, with more than 41 million licensed vehicles in total.
The size of the UK car fleet reflects long-term trends in population growth, household structure, and how long vehicles remain in use. While annual new car registrations rise and fall with economic conditions, the total number of cars on the road has continued to increase gradually. Longer vehicle lifespans, the growth of multi-car households, and continued reliance on private transport outside major cities all contribute to the UK’s large and persistent car parc.
In 2026, cars remain the dominant form of personal transport across the country, shaping road usage, congestion, emissions, and vehicle logistics.
How Many UK Households Own a Car?
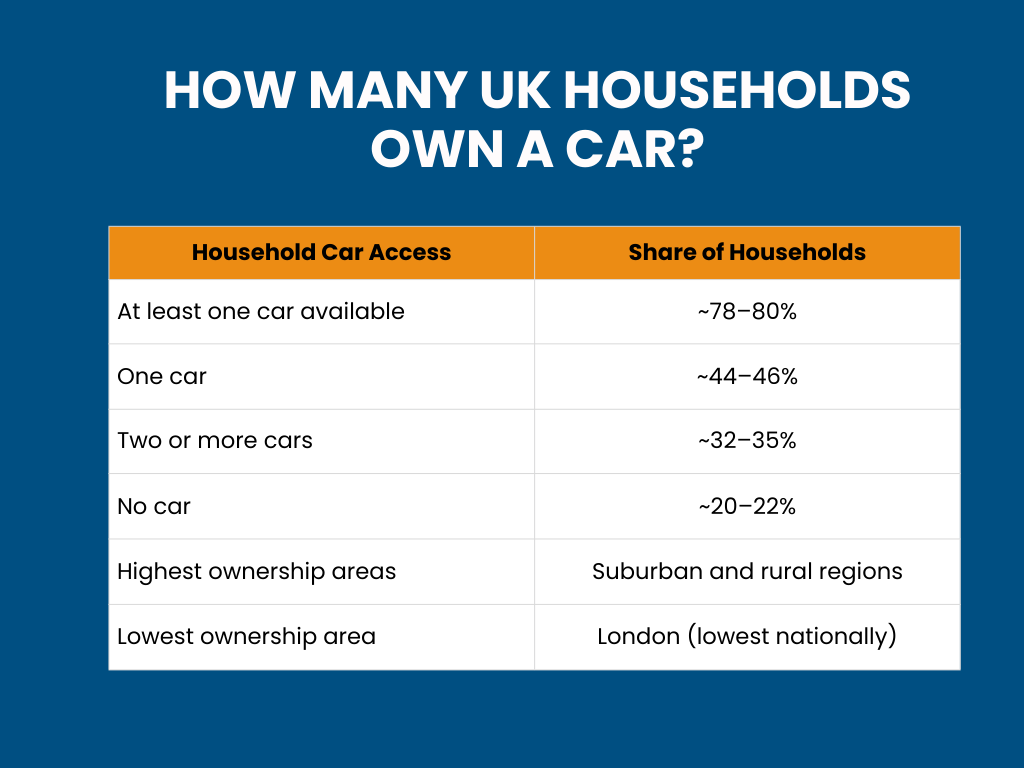
Household car ownership is one of the clearest indicators of how dependent people are on private transport. Ownership varies sharply by location: dense urban areas with extensive public transport tend to have lower car access, while suburban and rural communities rely more heavily on cars for commuting, education, shopping, and healthcare. Over time, multi-car households have become increasingly common outside major cities, reflecting the need for flexibility when work and services are spread out.
In practical terms, household car access helps explain why car mileage remains high and why long-distance vehicle movements (relocation, online purchases, auctions) continue to grow: a car is not just a luxury in many parts of the UK—it’s basic infrastructure for everyday life.
How Far Do Cars in the United Kingdom Travel Each Year?
Cars in the UK travel around 250–260 billion miles per year, with the average car covering roughly 7,000–7,500 miles annually.
Total mileage shows how intensively cars are used and how reliant the UK remains on road transport. While commuting patterns have evolved, especially with hybrid work, overall car travel remains close to historic highs. Cars continue to dominate longer journeys and are especially critical in areas with limited rail or bus services. Rural drivers typically travel substantially more miles than urban drivers, contributing to higher per-car averages outside cities.
High mileage also helps explain ongoing pressure on the road network and why efficiency gains—such as shared transport and better route utilisation—can have outsized impacts on costs and emissions.
How Congested Are Roads in the UK?
A small proportion of UK roads carry a disproportionately large share of traffic, with motorways and major A-roads handling around 30–35% of all vehicle miles despite making up roughly 2% of road length.
The United Kingdom road network is highly concentrated around strategic corridors linking major cities, ports, and economic centres. These routes absorb most long-distance travel, freight movement, and seasonal traffic, making them particularly sensitive to disruption, population growth, and changes in travel behaviour. Even small increases in demand can quickly translate into congestion on these key links.
Petrol cars remain the single largest category of cars on UK roads, while diesel continues its long-term decline following policy changes, clean air zones, and shifting consumer preferences. Hybrid vehicles now act as a transitional technology for many households, particularly outside major cities, where charging access remains uneven.
The composition of the fleet matters because it directly influences emissions, fuel demand, running costs, and how vehicles are used. Older petrol and diesel cars tend to remain in service longer in rural and lower-income areas, while newer electric and hybrid vehicles are more concentrated in urban and suburban regions.
Fuel type distribution (cars only)
- Petrol: ~55–58%
- Diesel: ~28–30%
- Hybrid (HEV & PHEV): ~8–10%
- Battery electric (BEV): ~6–8%
- Other (LPG, hydrogen, etc.): <1%
Although electric cars still represent a minority of vehicles on the road, they account for a much larger share of new registrations, meaning the balance will continue to shift as older cars are retired.
How Fast Are Electric Vehicles Growing in the United Kingdom?
In 2026, the United Kingdom has well over 2 million plug-in vehicles on the road, including both fully electric and plug-in hybrids.
However, fleet turnover is slow. With the average car approaching 10 years old, it takes time for changes in new registrations to materially reshape the overall car parc. This explains why petrol and diesel cars still dominate total mileage even as EV sales grow rapidly.
Key EV indicators:
- Share of new car registrations (BEV): ~22–25%
- Total plug-in cars on the road: ~2–2.5 million
- Average EV annual mileage: slightly below ICE average
- EV ownership concentration: urban & commuter belts
Charging access remains a limiting factor for some households, particularly those without off-street parking. This uneven infrastructure rollout reinforces regional differences in vehicle choice and usage.
What Do UK Car Statistics Say About Emissions?
Cars remain one of the largest sources of transport emissions in the UK, even as overall emissions per mile continue to fall. Efficiency improvements, cleaner engines, and electrification have reduced average emissions, but high mileage levels offset many of these gains.
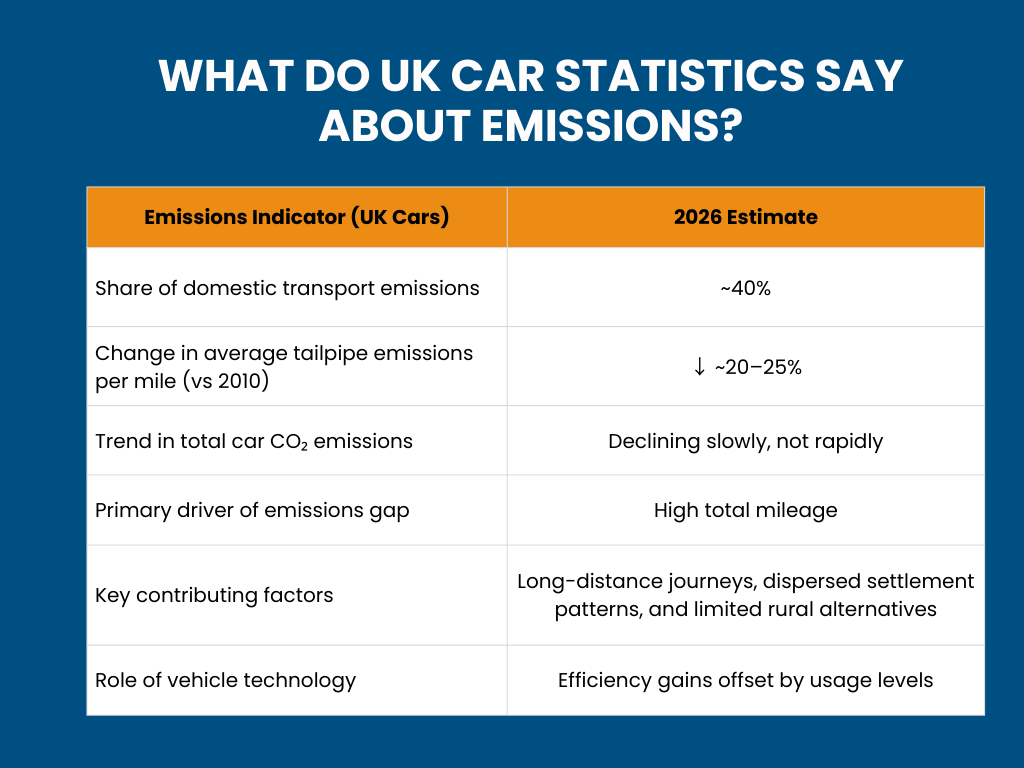
This gap between per-vehicle efficiency and total emissions is driven by how much cars are used, not just what powers them. Long-distance journeys, dispersed settlement patterns, and limited alternatives in rural areas all sustain high car dependency.
Summary: United Kingdom Car Statistics in 2026
- The United Kingdom has 33–35 million cars, and the fleet is still growing slowly
- Around 80% of households have access to at least one car
- Cars travel ~250–260 billion miles per year, near historic highs
- Petrol and diesel still dominate, but EVs are growing rapidly
- Long-distance vehicle movements are increasing due to digital car sales
- Emissions per mile are falling, but total mileage keeps pressure high
Move Your Car Anywhere in the UK
Compare quotes from trusted transport providers and save up to 75% compared to standard rates. Tell us where your vehicle needs to be collected and delivered, and you’ll receive competing quotes in minutes. Choose a provider based on price, reviews, and availability; you stay in control the whole way. Add optional protection for extra peace of mind on higher-value vehicles. Get quotes now and book your vehicle delivery at your convenience.
Sources: RAC Foundation, G&M Direct Hire, GOV.UK (Vehicle Statistics), GOV.UK (Road Traffic Statistics), TyreSafe